
For American households, 2025 ended with a number that immediately grabs attention: $87,460.
That was the real median household income in the United States, according to newly released Census Bureau data. It was the highest figure in the bureau’s records, which stretch back to 1967. At the same time, the country’s official poverty rate fell to 10.2%, also a record low.
On paper, that sounds like a simple economic success story.
Look a little closer, though, and there is more to it.
The income number is a national median, not a paycheck that most Americans suddenly started taking home. And while the overall figure climbed, the Census Bureau found that income did not rise significantly at the bottom of the income distribution.
So what actually happened to American household income in 2025?
Read more: Trump Threatens to Rename Lake Ontario “Lake America”
U.S. Household Income Reached a New Record
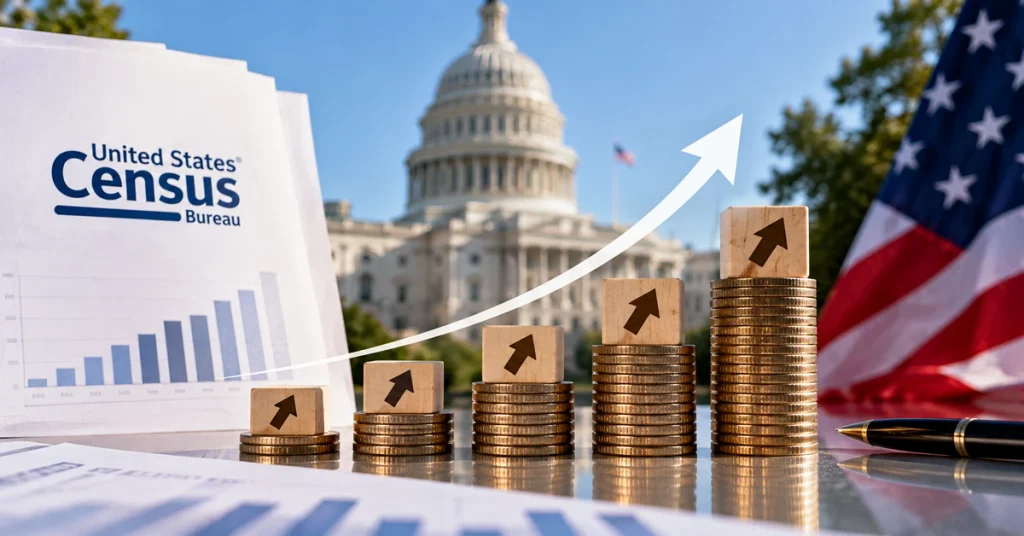
The Census Bureau reported that real median household income rose 2.6%, from $85,210 in 2024 to $87,460 in 2025.
The figures are adjusted for inflation and expressed in 2025 dollars, making the comparison more meaningful across different years.
That $87,460 figure is important because it moved above the previous record.
It also gives us a useful starting point for understanding the American economy in 2025. But one word matters here: median.
What Does $87,460 Actually Mean?
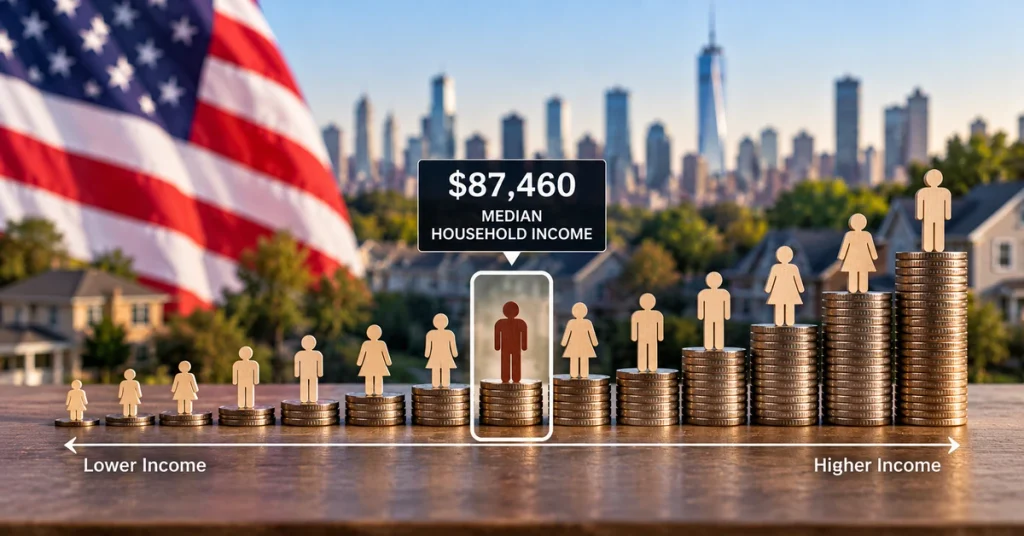
Imagine putting every U.S. household in a line, starting with the household earning the least and ending with the household earning the most.
The household sitting right in the middle would represent the median.
Half of households would have higher incomes, while half would have lower incomes.
That means the $87,460 figure does not mean the average American household earned $87,460. It also does not mean every household saw its income rise by 2.6%.
It is simply the middle point of the income distribution.
And that distinction becomes important when looking at the rest of the Census data.
Read more: Trump Promises $5,000 Dividend Check to Every Adult Citizen
The Increase Was Real, But It Wasn’t Evenly Spread
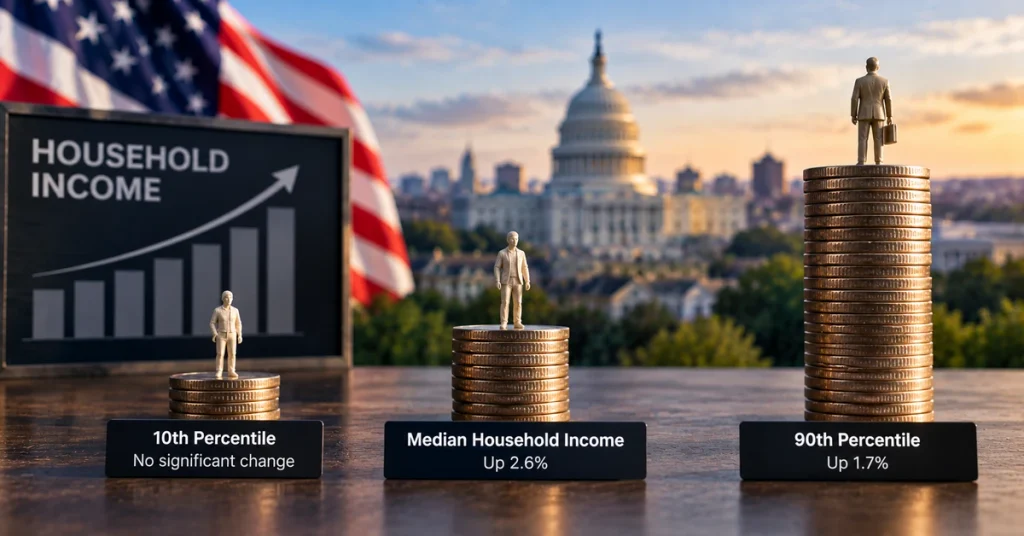
The headline number is encouraging, but the income distribution tells a more nuanced story.
According to the Census Bureau, household income at the 90th percentile increased 1.7% between 2024 and 2025.
At the 10th percentile, however, income did not change significantly.
That means the record median should not be read as evidence that every income group experienced the same improvement.
The Census Bureau also found that overall income inequality, measured by the Gini index, was not significantly different from 2024.
There was another movement in post-tax income. Median household income after accounting for taxes and credits rose 3.1%, from $73,760 in 2024 to $76,060 in 2025.
For households watching their budgets, that measure provides another way to look at how much income remained after taxes and credits.
Poverty Fell to 10.2%

Then came the other major headline from the Census report.
The official U.S. poverty rate fell from 10.7% in 2024 to 10.2% in 2025.
That was a decline of half a percentage point and the lowest rate in the Census Bureau’s historical series.
Still, 10.2% represents a large number of people.
About 34.5 million Americans were counted as living in poverty in 2025 under the official measure.
The child poverty rate also fell to 13.4%, a historic low.
So while the national percentage moved down, millions of people were still below the official poverty threshold.
Read more: Trump Says Gas Could Fall Below $2 a Gallon After Iran War
Why Are There Two Different Poverty Numbers?
This is where the story gets a little more complicated.
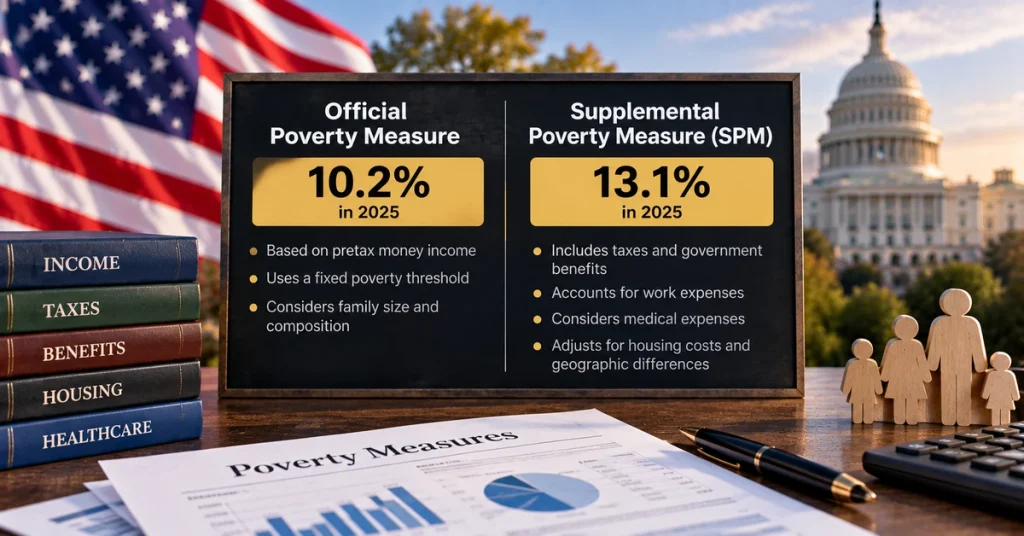
You may see another figure in coverage of the Census report: 13.1%.
That’s the Supplemental Poverty Measure, or SPM.
The official poverty measure primarily compares pretax money income with a poverty threshold based on family size and composition.
The SPM takes a broader approach. It accounts for taxes, government benefits, work expenses, medical expenses and geographic differences in housing costs.
In 2025, the SPM poverty rate was 13.1%.
So when you see 10.2% and 13.1% in different reports, they are not necessarily contradicting each other.
They are measuring poverty using different methods.
What About the Cost of Living?

A record household income figure does not automatically tell us how comfortable households felt financially.
Income is only one side of the equation.
Families also have to deal with housing, food, transportation, healthcare, childcare and other expenses.
The Census income figure is inflation-adjusted, which helps account for changes in purchasing power. But individual households can still experience those costs very differently.
This is one reason a national median should be viewed as a broad economic indicator rather than a description of every family’s financial situation.
The Census data itself shows that income gains varied across the distribution.
A Six-Year Journey to a New Income Record

There’s another detail that makes the 2025 number interesting.
Although $87,460 is the highest real median household income in the Census series, the previous record was set years earlier.
The 2019 median was $85,320 in 2025 dollars.
The 2025 figure therefore represents a relatively modest real increase over that earlier peak, despite the years in between.
That period included the COVID-19 pandemic, major changes in employment and a sharp rise in consumer prices.
The record is significant, but it does not tell the entire economic story of the past six years.
U.S. Household Income 2025: Key Numbers
| Measure | 2024 | 2025 |
|---|---|---|
| Real median household income | $85,210 | $87,460 |
| Official poverty rate | 10.7% | 10.2% |
| People in official poverty | — | 34.5 million |
| Child poverty rate | — | 13.4% |
| Median post-tax household income | $73,760 | $76,060 |
| Supplemental Poverty Measure | — | 13.1% |
What the Numbers Really Tell Us
There are two major headlines here.
American median household income reached a record $87,460 in 2025. At the same time, the official poverty rate fell to 10.2%.
Those are significant changes in the national data.
Yet the numbers don’t mean every American household suddenly became better off.
Income growth differed across the distribution, and the Census Bureau found no statistically significant increase at the 10th percentile.
That’s why the most interesting part of this report may not be the record itself.
It is the gap between the headline and the details.
The U.S. economy produced a record median household income in 2025. At the same time, 34.5 million people remained below the official poverty line.
Both facts can be true at once.
And together, they give a much clearer picture of where American households stood in 2025.
FAQ
What was the U.S. median household income in 2025?
Real median household income was $87,460 in 2025, up 2.6% from $85,210 in 2024.
Was $87,460 the highest U.S. household income on record?
Yes. The Census Bureau reported that $87,460 was the highest real median household income in its historical series dating back to 1967.
What was the U.S. poverty rate in 2025?
The official poverty rate was 10.2%, down from 10.7% in 2024.
How many Americans were living in poverty in 2025?
The Census Bureau counted approximately 34.5 million people as living in poverty under the official measure.
What was the child poverty rate in 2025?
The official child poverty rate fell to 13.4%, the lowest level recorded in the Census Bureau’s historical series.
Why is the Supplemental Poverty Measure higher than the official poverty rate?
The SPM uses a broader calculation that includes factors such as taxes, government benefits, work expenses, medical expenses and housing costs. It was 13.1% in 2025, compared with 10.2% under the official measure.